
Slow applications affect every aspect of your business, from conversions and infrastructure budget all the way to your customers' patience. This guide will walk you through a clear, repeatable framework for application performance optimization. You'll learn how to:
- Measure the right metrics
- Identify where you're losing time
- Optimize the right layer of your stack
- Confirm that every change delivers a measurable result
- Validate results for continued application performance improvement
What Is Application Performance Optimization?
Application performance optimization is the ongoing process of measuring how an application behaves under real conditions, and making targeted changes to improve its performance without introducing new risks.
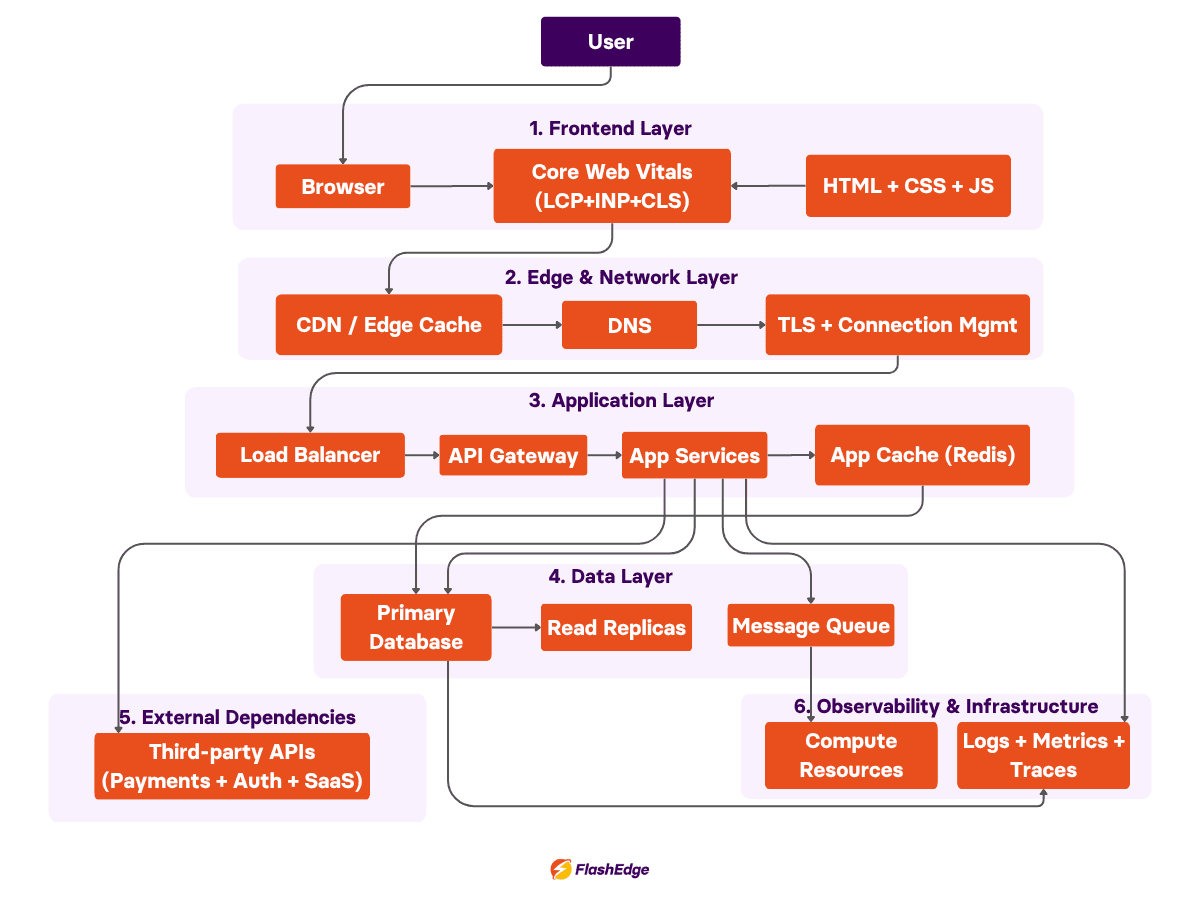
It covers the entire request path, from the user's browser through the frontend, APIs, backend services, databases, external dependencies, and infrastructure.
It's distinct from a single fix. Rewriting a slow SQL query is a single optimization, but application performance optimization is the discipline that tells you which query to look at first, and how to confirm the fix worked.
Why Application Performance Optimization Matters
There are both technical and financial arguments for why you should invest in performance.
On the technical side, slow applications compound their own problems.
High response times increase the number of concurrent requests a server has to hold open, which increases memory and connection pool pressure, which slows the application further.
Poor performance in one service can cascade through a distributed system, so a minor delay in one dependency turns into a timeout in another.
On the business side, slower page loads and API responses correlate with higher bounce rates, lower conversion rates, and reduced engagement, particularly for e-commerce and SaaS products where every extra second of load time is a point where a user can abandon the session.
Infrastructure cost is the other half of the equation: an inefficient application typically needs more compute, database capacity, and bandwidth to serve the same traffic, turning performance debt directly into a larger cloud bill.
What Application Performance Optimization Aims To Achieve
- Reducing response time and latency for end users
- Increasing throughput so the application handles more concurrent requests without degrading
- Improving reliability and reducing error rates under load
- Lowering infrastructure cost per request through more efficient resource use
- Maintaining performance as traffic, data volume, and complexity grow
It's possible for some of these goals to compete. For example, a cache layer that improves response time might add operational complexity, and a more powerful database instance could improve throughput but raise cost.
Part of the process of application performance optimization is deciding which trade-offs are preferable for your application and users.
Why Optimization Is An Ongoing Process
Application performance needs to keep up with the shifting shape of your business, such as application code changes, shifting traffic patterns, growing data volumes, and the evolution of third-party dependencies.
To catch regressions before users do, it's best to build optimization into your code review, deployment pipelines, and monitoring. If you only look into your performance output after a complaint, you'll always be working reactively.
How to Measure Application Performance Before Optimization
When teams approach optimization without measuring first, it can lead to wasted time optimizing a component that was never the actual bottleneck.
The starting point for any application performance improvement effort is a clear, current picture of how the system behaves, not how it's assumed to behave.
At minimum, we'd recommend you track the following metrics before making changes:
| Metric | What it measures | Why it matters |
|---|---|---|
| Response time | Time from request received to response sent | Direct indicator of user-perceived speed |
| Latency | Delay at each hop in the request path | Shows where in the chain time is lost |
| Throughput | Requests processed per unit of time | Shows capacity and how it changes under load |
| Error rate | Percentage of requests that fail or time out | Reveals instability that often precedes collapse |
| CPU and memory usage | Resource consumption on servers | Flags exhaustion before it causes downtime |
| Database query time | Time spent executing queries | Often the largest contributor to slow responses |
| Cache hit ratio | Requests served from cache vs. origin | Affects both speed and backend load |
To see how your application performs under pressure, take baseline measurements of these metrics under normal traffic and then under peak/simulated load. These measurements will also help you double-check that the optimization didn't just move the bottleneck somewhere else; for example, a faster API could put additional pressure on your database, or a larger cache could reduce latency but increase memory consumption.
Taking these baseline measurements early allows you to validate whether your optimizations have worked.
Performance should also be measured from the user's perspective. Google's Core Web Vitals focus on three aspects of real user experience: Largest Contentful Paint (LCP) measures loading performance, Interaction to Next Paint (INP) measures responsiveness, and Cumulative Layout Shift (CLS) measures visual stability. Together they help determine whether optimizations actually improve the experience users perceive, rather than simply improving synthetic benchmark scores.
How to Identify Performance Bottlenecks
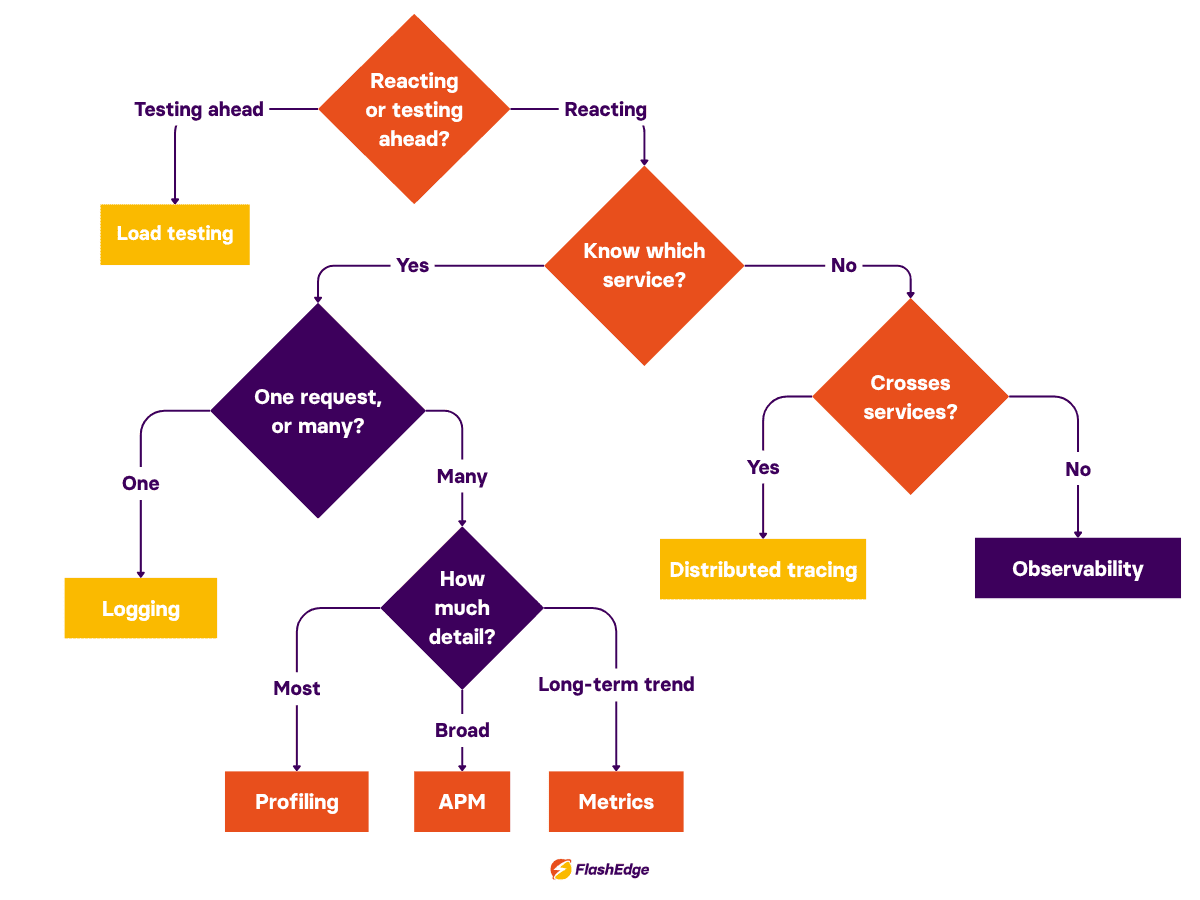
Once you've taken baseline measurements to see what "normal" looks like, you can find where performance breaks down using the following systems:
- Profiling shows where CPU time and memory are spent, function by function; most useful for finding specific hot paths within a service.
- Application Performance Monitoring (APM) is a continuous, aggregated view of how an application performs across all its instances: response times by endpoint, error rates, throughput, and resource usage over time.
- Distributed tracing follows requests end-to-end and shows how much time was spent in each service and network hop along the way. AWS provides a detailed overview of how distributed tracing works in practice through its X-Ray documentation.
- Logging is one of the most direct sources of truth for what happened during a specific request or error, especially when metrics show something went wrong but don't show why.
- Metrics are numeric time series data like response times, error counts, queue depths, and resource usage. Tracking them makes trends visible over time.
- Observability combines logs, metrics, and traces to give engineers a complete view of how a system is behaving.
- Load testing simulates production behaviour in a controlled staging environment, so you can test performance under peak conditions without touching real users. Wikipedia's overview of load testing covers the core methodology in more depth if you'd like to learn more.
How to Optimize Web Application Performance
Once you locate the bottleneck, you can optimize web application performance by targeting it.
The sections below give a high-level view of the most common app performance optimization opportunities at each layer of the stack. For a deeper look at network-specific fixes, check out our guide on network performance optimization techniques.
Frontend Strategies to Improve Performance of Web Application
On the frontend, the biggest improvements you can make usually come from reducing the amount of data the browser downloads, minimizing the number of round trips it makes, and improving how quickly users can interact with the page.
When you look to improve performance of web application frontends, key techniques include:
- Compressing and sizing images correctly to improve LCP
- Minimizing and bundling JavaScript and CSS to reduce unnecessary processing and improve INP
- Deferring non-critical scripts so important content can render sooner
- Using browser caching so repeat visitors don't re-download unchanged assets
Backend Optimization Techniques for Faster Application Performance
Backend optimization targets how efficiently application code processes each request. Common approaches include:
- Reducing unnecessary computation in hot code paths
- Replacing synchronous blocking calls with asynchronous processing where appropriate
- Batching operations instead of issuing them one at a time
- Adding application-level caching for data that doesn't need to be recalculated on every request
Connection pooling is one of the most reliable web application performance improvement techniques. By reusing expensive resources such as database or HTTP connections instead of recreating them for every request, applications reduce overhead that scales with traffic. If your application performs long-running work such as report generation or image processing, moving those tasks into asynchronous background workers can also reduce request latency without reducing functionality.
Database Optimization Strategies to Improve Application Performance
Database performance is frequently the single largest contributor to slow response times, making it one of the highest-leverage places to focus effort. Key techniques include:
- Indexing columns used in frequent queries and joins
- Rewriting queries that scan more data than necessary
- Adding caching layers for frequently accessed data to reduce repeated database queries and improve response times for read-heavy workloads
- Denormalizing where read performance matters more than write simplicity
- Introducing read replicas to distribute query load
Connection limits and query timeouts also deserve attention, since a database under pressure can silently degrade everything above it.
Network Optimization to Reduce Latency and Improve Scalability
Network optimization focuses on reducing the time data spends in transit and the round trips required to complete a request. This includes:
- Using a content delivery network to serve static content from locations closer to users
- Enabling compression and TLS session resumption to cut per-connection overhead
- Reducing the number of separate requests a page or API call requires
Before introducing new infrastructure, it's worth confirming that unnecessary round trips, oversized assets, and inefficient caching aren't contributing more latency than the network itself. For a deeper dive, see our guide on identifying and fixing network performance issues.
Infrastructure & App Performance Optimization
At the infrastructure layer, optimization is about matching capacity to actual demand.
- Autoscaling adjusts compute resources based on real traffic instead of provisioning for worst-case load at all times
- Right-sizing instances avoids paying for unused resources
- Horizontal scaling (adding more instances rather than larger ones) often provides better resilience against spikes
- Techniques like rate limiting, request queuing, and graceful degradation also help protect critical services instead of allowing overload to cascade through the platform.
A CDN can also reduce origin load and infrastructure costs by serving cacheable content closer to users and reducing the number of requests that reach your application servers. FlashEdge offers a free trial so you could see what difference it makes with your infrastructure.
How to Prioritize Application Performance Improvement
Not every bottleneck deserves equal attention, and few teams have time to fix everything at once. A simple way to prioritize is to weigh the impact and the effort.
- High-impact, low-effort changes, like adding a missing database index or enabling compression, should generally come first.
- High-impact, high-effort changes, like re-architecting a service or introducing a new caching layer, should be planned deliberately rather than attempted under pressure during an incident.
- Low-impact changes, regardless of effort, are usually better left alone unless bundled with other work.
Impact should be measured against the metrics established earlier, not assumed. A change that looks significant in isolation might affect an endpoint that receives a fraction of a percent of total traffic. Prioritizing by how many users are actually affected, rather than which problem is most visible, keeps effort aligned with real business impact.
Conclusion
Application performance optimization works best as a repeatable framework, not just a one-time cleanup. By measuring first, you ensure your decisions are based on real data; without baseline data, teams cannot know whether a change improved performance or simply moved the bottleneck elsewhere.
Use profiling, APM, distributed tracing, logging, and load testing together to find where performance actually breaks down. Target fixes at the layer where the bottleneck lives, whether that's the frontend, backend, database, network, or infrastructure. Prioritize by impact and effort, and confirm every change against the metrics you started with.
Finally, remember that optimization isn't complete once performance improves. Continue monitoring key metrics after every significant deployment so regressions are detected before they affect users.
A CDN is often one of the highest-leverage pieces of that framework since it reduces latency, origin load, and infrastructure cost at once. If you want to see how that fits into your stack, FlashEdge offers a free trial; you can use it to test the impact on your own traffic.
Frequently Asked Questions
What is the difference between application performance optimization and performance tuning a web application?
Performance tuning usually refers to a specific, targeted adjustment, such as changing a database configuration parameter or rewriting a slow function. Application performance optimization is the broader, ongoing process, including measurement, bottleneck identification, prioritization, and validation; tuning is one part of that.
How often should application performance be reviewed?
Performance should be reviewed continuously through monitoring and alerting, with deeper reviews tied to major releases, traffic growth, or infrastructure changes. Waiting for a complaint or outage to trigger a review means problems cost more to fix by the time they're caught.
What is the biggest cause of poor application performance?
There's no single universal cause, but inefficient database queries are among the most common sources of slow response times, followed by unnecessary network round trips and unoptimized frontend assets.
Can application performance optimization reduce infrastructure costs?
Yes. Reducing the compute, memory, and bandwidth required to serve the same traffic, through caching, query optimization, and efficient resource use, lowers infrastructure spend alongside improving user experience.
Do small applications need the same optimization process as large ones?
The scale of effort differs, but the process doesn't. Even a small application benefits from measuring before optimizing, since assumptions about where time is being lost are wrong more often than expected, regardless of size.