
Network Performance Issues: How to Identify, Troubleshoot, and Fix Them
It's rarely difficult to spot the symptoms of network performance issues, but identifying them is a common pain point for organizations. When users report slow applications, lagging video calls, failed API requests, or intermittent connectivity, it's clear there's an issue–but what is the source? This guide will explain the most common causes of network performance issues, how to root them out, and what to monitor to quickly identify future problems.
Quick summary
- Most network performance issues are caused by latency, packet loss, congestion, DNS delays, or routing problems.
- Effective troubleshooting starts with collecting performance data before making changes.
- Monitoring key metrics helps teams identify bottlenecks faster and reduce downtime.
- Ongoing monitoring and edge delivery strategies can help prevent future performance problems.
Why network performance matters
Many modern applications rely on cloud services, APIs, and distributed infrastructure. Even a small network issue can affect multiple systems at once, leading to slow applications, disruption to communication tools, and ultimately customer frustration and reduced productivity.
What are network performance issues?
Network performance issues are any conditions that reduce the speed, reliability, or responsiveness of network communications. Users may experience slow page loads, delayed application responses, connection drops, or inconsistent performance across regions.
Several different problems can produce similar symptoms, so monitoring is necessary to quickly troubleshoot the issue.
The most common network performance problems
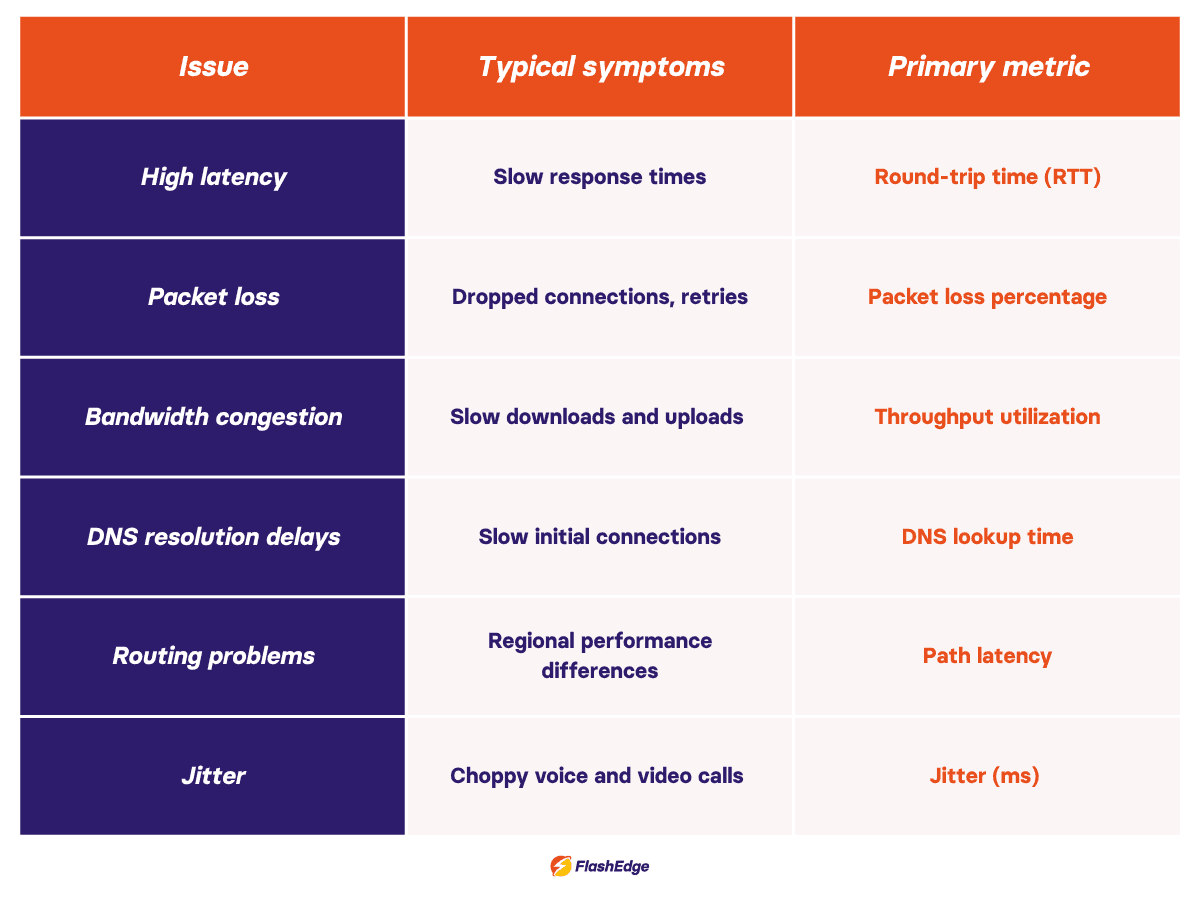
High latency slows every interaction
Latency measures how long it takes data to travel between two points. High latency is one of the most common network performance issues because it affects almost every application. Round Trip Time (RTT)—the time it takes for a signal to travel from sender to receiver and back—is one of the primary metrics used to measure and diagnose latency. Long physical distances, congested network paths, inefficient routing, and overloaded infrastructure are all common causes, but you can use tools like ping and traceroute to identify latency-related issues.
Packet loss creates unreliable performance
Packet loss occurs when data packets fail to reach their destination. Even small amounts of packet loss can cause noticeable network performance problems, particularly for voice, video, and real-time applications. Common causes include congestion, faulty hardware, overloaded devices, and wireless interference.
Bandwidth congestion reduces available capacity
Congestion happens when traffic demand approaches or exceeds available bandwidth. Applications may become slower as packets queue for transmission. Monitoring throughput and utilization trends can help identify whether congestion is contributing to slow network performance.
DNS resolution delays add hidden latency
Before a device can connect to a website or API, it must perform a DNS lookup. DNS acts as the internet's directory service, translating domain names into IP addresses before connections can be established. Slow DNS responses can delay connections even when the application itself is healthy. Monitoring DNS response times alongside application metrics helps uncover issues that are often overlooked.
Routing problems affect some users more than others
Traffic does not always take the most efficient path across the internet. Routing problems can create large performance differences between regions. If users in one location consistently experience worse performance than others, routing should be investigated as a possible cause.
A framework for network performance troubleshooting
Many teams waste time troubleshooting performance issues because they start applying fixes before understanding the problem. A structured approach is usually faster.
Step 1: Define the problem
Identify who is affected, when the issue occurs, and whether it impacts specific applications, locations, or users.
Step 2: Gather performance data
Review latency, packet loss, throughput, DNS response times, logs, and application metrics. Good troubleshooting starts with measurements, not assumptions.
Step 3: Isolate the bottleneck
Determine where degradation is occurring. The bottleneck may be the client device, local network, ISP, cloud provider, or application itself. Continuous network performance monitoring makes this process significantly easier because historical data is already available.
See the FlashEdge blogpost on bottlenecks in networking for more information.
Step 4: Test potential fixes
Implement changes methodically and avoid making multiple adjustments at once. Examples include increasing bandwidth, optimizing DNS configuration, or replacing faulty hardware.
Step 5: Validate improvements
Compare performance metrics before and after changes. Successful fixes should produce measurable improvements rather than relying solely on user feedback.
Step 6: Implement ongoing monitoring
Once the issue is resolved, establish monitoring and alerting to detect future problems before users report them.
Network performance metrics you should monitor
The following metrics provide a good baseline for ongoing network performance monitoring:
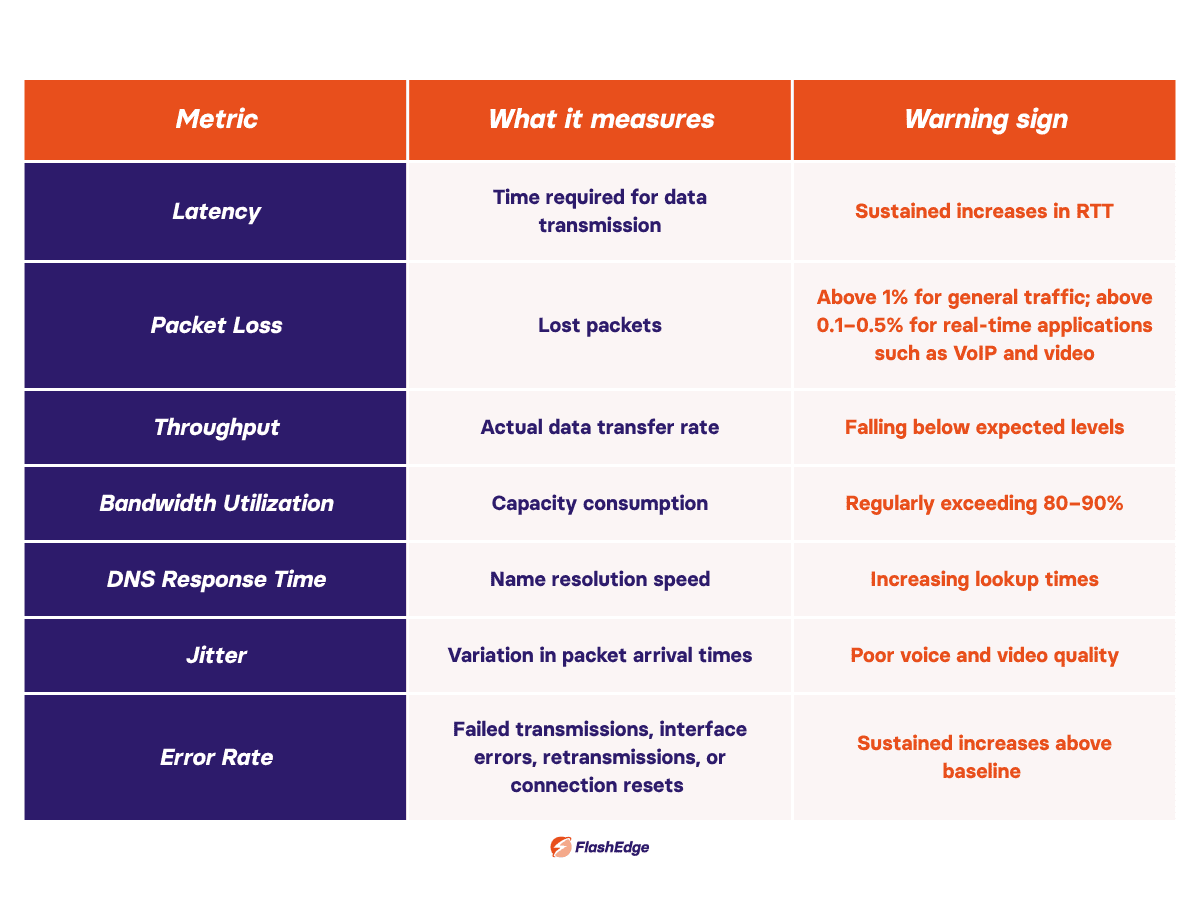
For a deeper look at monitoring strategies, see the FlashEdge guide to network performance monitoring.
How to prevent future network performance issues
Use monitoring, planning, and optimization together
Continuous monitoring covering latency, packet loss, throughput, and error rates across all critical paths gives you the visibility to catch performance problems before users notice them. Tools like synthetic monitoring and real user monitoring (RUM) can help you proactively identify bottlenecks and understand your actual users' experience.
Tracking bandwidth utilization trends and modeling traffic growth lets you provision headroom before congestion becomes a bottleneck.
Regular operational reviews reduce accumulated risk–auditing BGP routing configurations, DNS TTLs, and hardware health metrics on a scheduled basis brings latent issues to the surface before they compound.
Reduce latency with edge delivery
CDNs reduce latency by serving content from edge locations closer to users, shortening network paths, and improving responsiveness without the need for additional origin infrastructure. By caching static assets at the edge, CDNs also reduce the volume of requests reaching the origin server, which lowers processing overhead and speeds up delivery for all users. For dynamic content, many CDNs use optimized routing and persistent connections between edge nodes to cut transit time even when content cannot be cached. Learn more about how CDNs reduce latency on the FlashEdge blog.
Conclusion
Network performance issues can come from many different causes, but the troubleshooting process doesn't have to be opaque. Teams that resolve incidents faster usually share a few habits: monitor the metrics that reflect user experience, isolate bottlenecks at the layer where they originate, and validate every change in your configuration with before-and-after data. Infrastructure choices directly affect performance, especially as applications distribute across more cloud regions and edge locations.
Many of the issues discussed in this guide, including latency, routing inefficiencies, and network congestion, are influenced not just by temporary faults but by how traffic flows through your infrastructure. Architectural decisions such as distributing traffic across edge locations, reducing the distance between users and services, and optimizing delivery paths can significantly improve responsiveness and resilience.
FlashEdge helps engineering teams improve application performance through global edge delivery and low-latency content distribution. If you're dealing with performance challenges or planning infrastructure changes, try talking to one of our specialists for advice tailored to your environment, or try FlashEdge yourself with a free trial.
Frequently Asked Questions
What are the most common network performance issues?
The most common network performance issues are high latency, packet loss, bandwidth congestion, DNS delays, and routing problems. Each affects application performance differently and requires a different troubleshooting approach.
How do I identify problems related to performance of network infrastructure?
Start by measuring latency, packet loss, throughput, DNS response times, and bandwidth utilization. Comparing current performance against historical baselines helps identify the root cause more quickly.
What causes slow network performance when servers appear healthy?
Slow network performance can be caused by congestion, routing inefficiencies, packet loss, DNS delays, or ISP-related issues even when servers and applications are functioning normally.
Ready to start your journey to low latency and reliable content delivery?
If you’re looking for an affordable CDN service that is also powerful, simple and globally distributed, you are at the right place. Accelerate and secure your content delivery with FlashEdge.
Get a Free Trial