
Network performance monitoring is no longer just a concern for network teams. It now sits at the centre of application delivery and revenue protection; if a checkout page takes too long to load, users rarely open a ticket. They simply leave. That's why teams need to understand what users are actually experiencing in real time across different cloud regions, and what's causing it.
In this guide, we'll break down what network performance monitoring actually means, what metrics matter, how to monitor network performance without relying on dozens of dashboards, and why traditional approaches often miss the crucial moments of opportunity for early detection.
Quick Summary
- Network performance monitoring helps teams track latency, packet loss, jitter, throughput, and application responsiveness across distributed infrastructure.
- Real time network performance monitoring makes it easier to spot issues before users notice.
- Traditional monitoring often misses real user experience because modern applications depend on cloud providers, CDNs, third-party APIs, and edge infrastructure.
- Better network performance visibility comes from combining telemetry, diagnostics, traffic analysis, and edge delivery platforms that reduce latency closer to the user.
What is network performance monitoring?
At its core, network performance monitoring is the process of continuously measuring how a network behaves and how efficiently it delivers applications, services, and data between systems and users.
That includes monitoring things like:
- Latency
- Packet loss
- Bandwidth usage
- Throughput
- Jitter
- DNS response times
- Application delivery performance
- CDN (Content Delivery Network) latency
The goal is to understand whether users are getting a fast, stable experience, and to quickly identify the causes of any issues.
Modern network performance monitoring goes far beyond office networks and internal infrastructure. Applications now depend on cloud providers, APIs, SaaS platforms, remote employees, mobile users, and edge infrastructure spread across multiple regions. That's why enterprise network performance monitoring is closely tied to observability and customer experience.
For a broader technical overview of networking fundamentals, the Wikipedia article on TCP/IP is a useful refresher.
Why network performance monitoring matters more than teams expect
Many organisations discover network performance problems backwards, starting with customer complaints passed around through support tickets. By that point, the damage is already done.
Poor network performance affects almost every part of digital operations:
- Slow applications reduce conversion rates
- Laggy SaaS tools hurt employee productivity
- API delays break integrations
- Streaming interruptions damage user trust
- Downtime directly impacts revenue
- Regional latency issues create inconsistent experiences
Even small delays add up. Research consistently shows users become less tolerant as page load times increase, and that expectation is stricter for applications, streaming, and interactive services. As a result, network performance analysis is now closely linked to business metrics—infrastructure teams are now directly influencing customer retention and operational reliability.
What to monitor in network performance
One of the most common mistakes when analysing network performance is collecting too much data without understanding what actually matters. A good monitoring strategy focuses on metrics that explain user experience clearly.
Latency: Latency measures how long it takes for data to travel between systems. High latency usually shows up as slow applications, delayed API responses, sluggish video calls, or slow websites.
Packet loss and jitter: Packet loss happens when data packets fail to reach their destination. Jitter measures inconsistency in delivery timing. Together they cause buffering, unstable calls, dropped connections, and uneven application behaviour.
Throughput and bandwidth utilization: Throughput measures how much data is successfully transmitted. Bandwidth utilisation measures how much available capacity is being consumed. These metrics help identify congestion and overloaded infrastructure.
DNS and application response times: DNS delays are a surprisingly common contributor to slow user experience. Monitoring DNS resolution alongside application response times helps teams separate infrastructure problems from application-layer problems.
User experience metrics: Modern teams increasingly monitor page load times, API responsiveness, streaming quality, and regional delivery speed. That’s because these reflect real user experience rather than infrastructure assumptions.
How to monitor network performance without drowning in data
There are plenty of opinions on how best to monitor network performance, but most effective monitoring strategies combine a few core approaches.
Use continuous telemetry collection
Modern monitoring platforms continuously collect telemetry from routers, switches, servers, cloud infrastructure, applications, and endpoints. This includes network flow records, packet captures, synthetic tests, application metrics, log analysis, real user monitoring, and device telemetry such as SNMP data.
Collecting individual metrics is relatively easy. The real value comes from understanding how those signals connect during an incident. Network performance monitoring and diagnostics are most effective when telemetry can be correlated to reveal how infrastructure, applications, and user experience affect one another in real time.
Combine synthetic and real user monitoring
Synthetic monitoring tests services from controlled environments; real user monitoring tracks actual user experience. For effective monitoring you need both. Synthetic monitoring helps identify outages quickly, while real user monitoring shows whether users are actually affected.
A service might pass synthetic tests while still feeling slow for users in specific regions. In globally distributed applications, this is a common gap.
Monitor regional network performance
Performance varies heavily between regions, ISPs, and routing paths. A platform may work well in London but struggle in South America or Southeast Asia, which is why regional network performance reporting matters. Tools like CDNPerf’s latency benchmark give visibility into global CDN latency across regions.
When choosing a CDN, independent benchmarking tools can provide a more realistic view of performance than marketing materials alone. This is especially important for latency-sensitive workloads such as video streaming, APIs, or live content delivery.
💡Providers such as FlashEdge CDN can also be evaluated through CDNPerf benchmarks to compare regional latency and overall network responsiveness under real-world conditions.
Build alerting around impact, not noise
Good alerting focuses on user-facing degradation, sustained latency increases, regional anomalies, packet loss spikes, routing instability, and API performance degradation—not every temporary fluctuation.
The visibility gap in modern networks
Traditional monitoring was built for environments where most infrastructure stayed inside a controlled network perimeter. That's rarely true today.
Modern applications run across public cloud environments, edge networks, third-party APIs, SaaS platforms, remote employees, and multi-region deployments. User experience relies on all of them working together.
Why traditional monitoring misses real problems
A router can show healthy utilisation while users still experience poor application performance, because the bottleneck might sit outside your infrastructure entirely—ISP congestion, poor peering routes, DNS propagation issues, CDN edge saturation, or cloud region instability. This is why many organisations struggle with incomplete network performance visibility.
Cloud and edge architectures changed monitoring completely
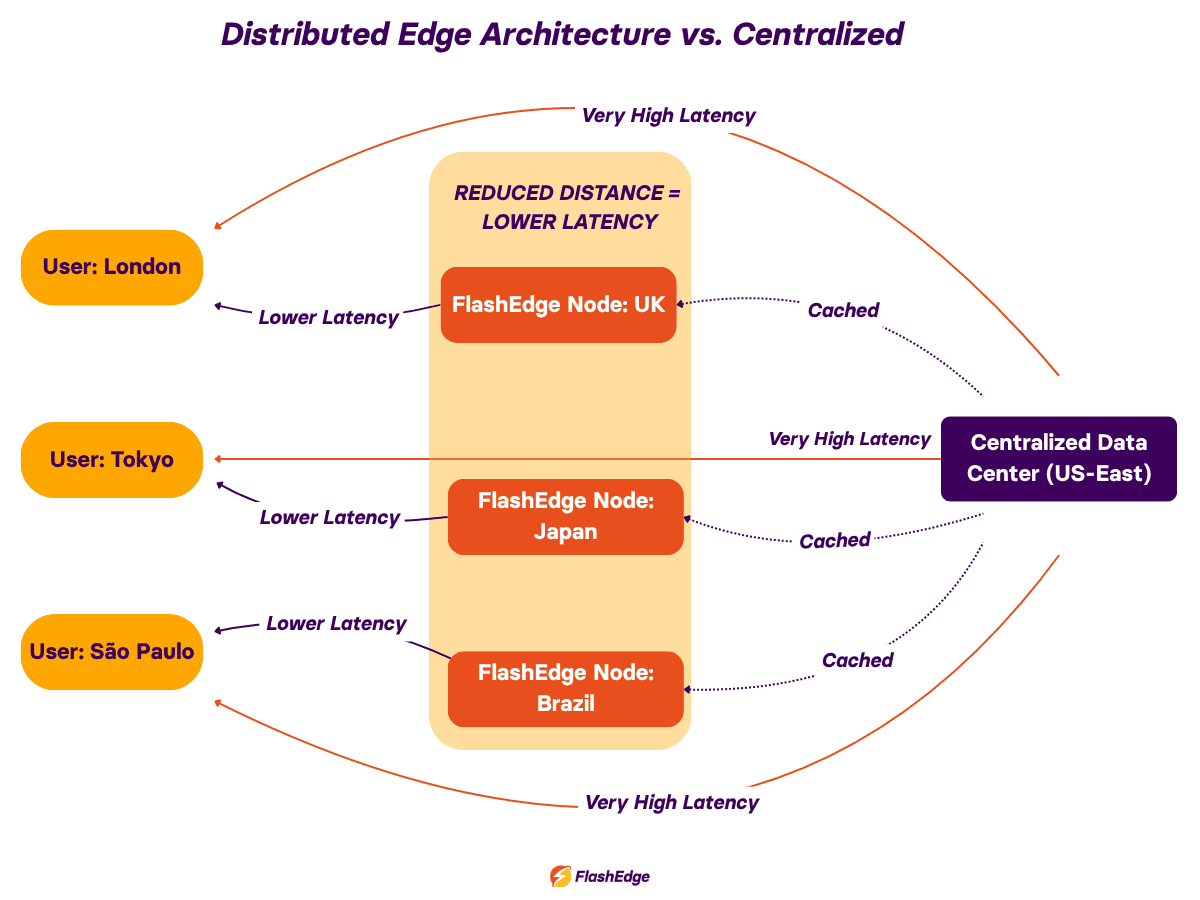
Edge computing and CDNs have improved performance by shifting applications closer to users, but also introduced more distributed complexity. Instead of traffic flowing through one centralised environment, requests now travel through multiple edge nodes, regional caches, cloud zones, and provider networks. The AWS guide to edge computing explains this shift well
As a result, real time network performance monitoring now requires visibility across environments organisations don't fully control.
Network performance monitoring and diagnostics in real time
The difference between reactive and proactive monitoring usually comes down to timing. Reactive monitoring tells you something broke; proactive monitoring tells you degradation is starting before users notice.
Modern network performance monitoring and diagnostics platforms focus on real-time traffic analysis, automated anomaly detection, route monitoring, packet inspection, end-user experience tracking, edge performance analytics, and historical trend analysis.
During an incident, the goal is to shorten investigation time, not spend hours debating whether the issue belongs to networking, cloud infrastructure, or application engineering.
Network performance reporting should help people think faster
Useful network performance reporting highlights meaningful trends, compares regional performance, surfaces anomalies quickly, shows user impact clearly, and connects infrastructure metrics with application behaviour. The best monitoring dashboards answer questions immediately.
How to improve network performance monitoring in distributed systems
Bring monitoring closer to the user
CDNs like FlashEdge reduce the distance between infrastructure and users. Content delivered closer to the edge benefits from lower latency, faster asset delivery, better regional consistency, and lower origin load. Modern CDN platforms also provide telemetry and analytics that help teams identify regional delivery problems and routing bottlenecks.
Use correlated observability instead of isolated monitoring
Infrastructure metrics alone are no longer enough. Teams increasingly combine network monitoring, application performance monitoring, log analysis, tracing, and user experience metrics. That broader observability approach makes it easier to analyze network performance in context.
Visibility is the foundation of reliable performance
Modern infrastructure is fast, distributed, and constantly changing, which makes network performance monitoring far more important than it used to be. Organizations need visibility not only into devices and bandwidth usage, but also into the actual user experience across cloud platforms, ISPs, APIs, CDNs, and edge environments.
The teams that succeed are usually the ones that combine strong monitoring fundamentals with real-world visibility.
Teams that succeed usually combine strong monitoring with real-world visibility. They all:
- Understand how traffic behaves globally.
- Monitor performance continuously.
- Correlate infrastructure signals with user impact.
- Reduce latency wherever possible.
Users don’t care why something feels slow; they only notice that it does.
If you want better global delivery visibility and lower latency performance across distributed environments, FlashEdge CDN helps bring content and applications closer to users through a globally distributed edge network designed for speed and reliability–try it out for free or consult our team for advice tailored to your organization.
FAQ
What is network performance monitoring?
Network performance monitoring is the process of continuously tracking network health, responsiveness, and reliability. It covers metrics like latency, packet loss, throughput, jitter, and application delivery performance.
Why is network performance monitoring important?
Poor network performance directly affects user experience, application responsiveness, and revenue. Monitoring helps teams identify issues quickly and reduce service degradation before users are heavily impacted.
What metrics should teams monitor?
The most important metrics include latency, packet loss, jitter, throughput, DNS response times, bandwidth utilisation, and real user experience indicators like page load speed or API response time.
How do you monitor network performance effectively?
Effective monitoring combines telemetry collection, synthetic testing, real user monitoring, traffic analysis, and network performance reporting. Teams should also monitor regional delivery performance across cloud and edge infrastructure.
What is the difference between network monitoring and observability?
Traditional monitoring focuses on predefined metrics and alerts. Observability combines metrics, logs, traces, and analytics to help teams understand why issues occur across distributed systems.
Why is real time network performance monitoring valuable?
It helps teams detect issues immediately, reduce troubleshooting time, and prevent small degradations from becoming larger outages.
How do CDNs improve network performance visibility?
CDNs provide regional delivery analytics, edge telemetry, latency measurements, and traffic insights that help teams understand how users experience applications across global networks.